A few weeks ago I published a summary of nine neat NASA resources for teachers and students. Shortly after that I received an email from someone at NASA who pointed me in the direction of My NASA Data.
My NASA Data is much more than just a collection of datasets published by NASA. My NASA Data contains lesson plans, data visualizations, and story maps. Those lesson plans, visualizations, and story maps are divided into six sections. Those sections are titled Atmosphere, Biosphere, Cryosphere, Geosphere, Hydrosphere, and Earth as System. Select a section to start exploring all of the visualizations, lesson plans, and story maps within it. In many cases you’ll find additional lesson plans included within the visualizations and story maps.
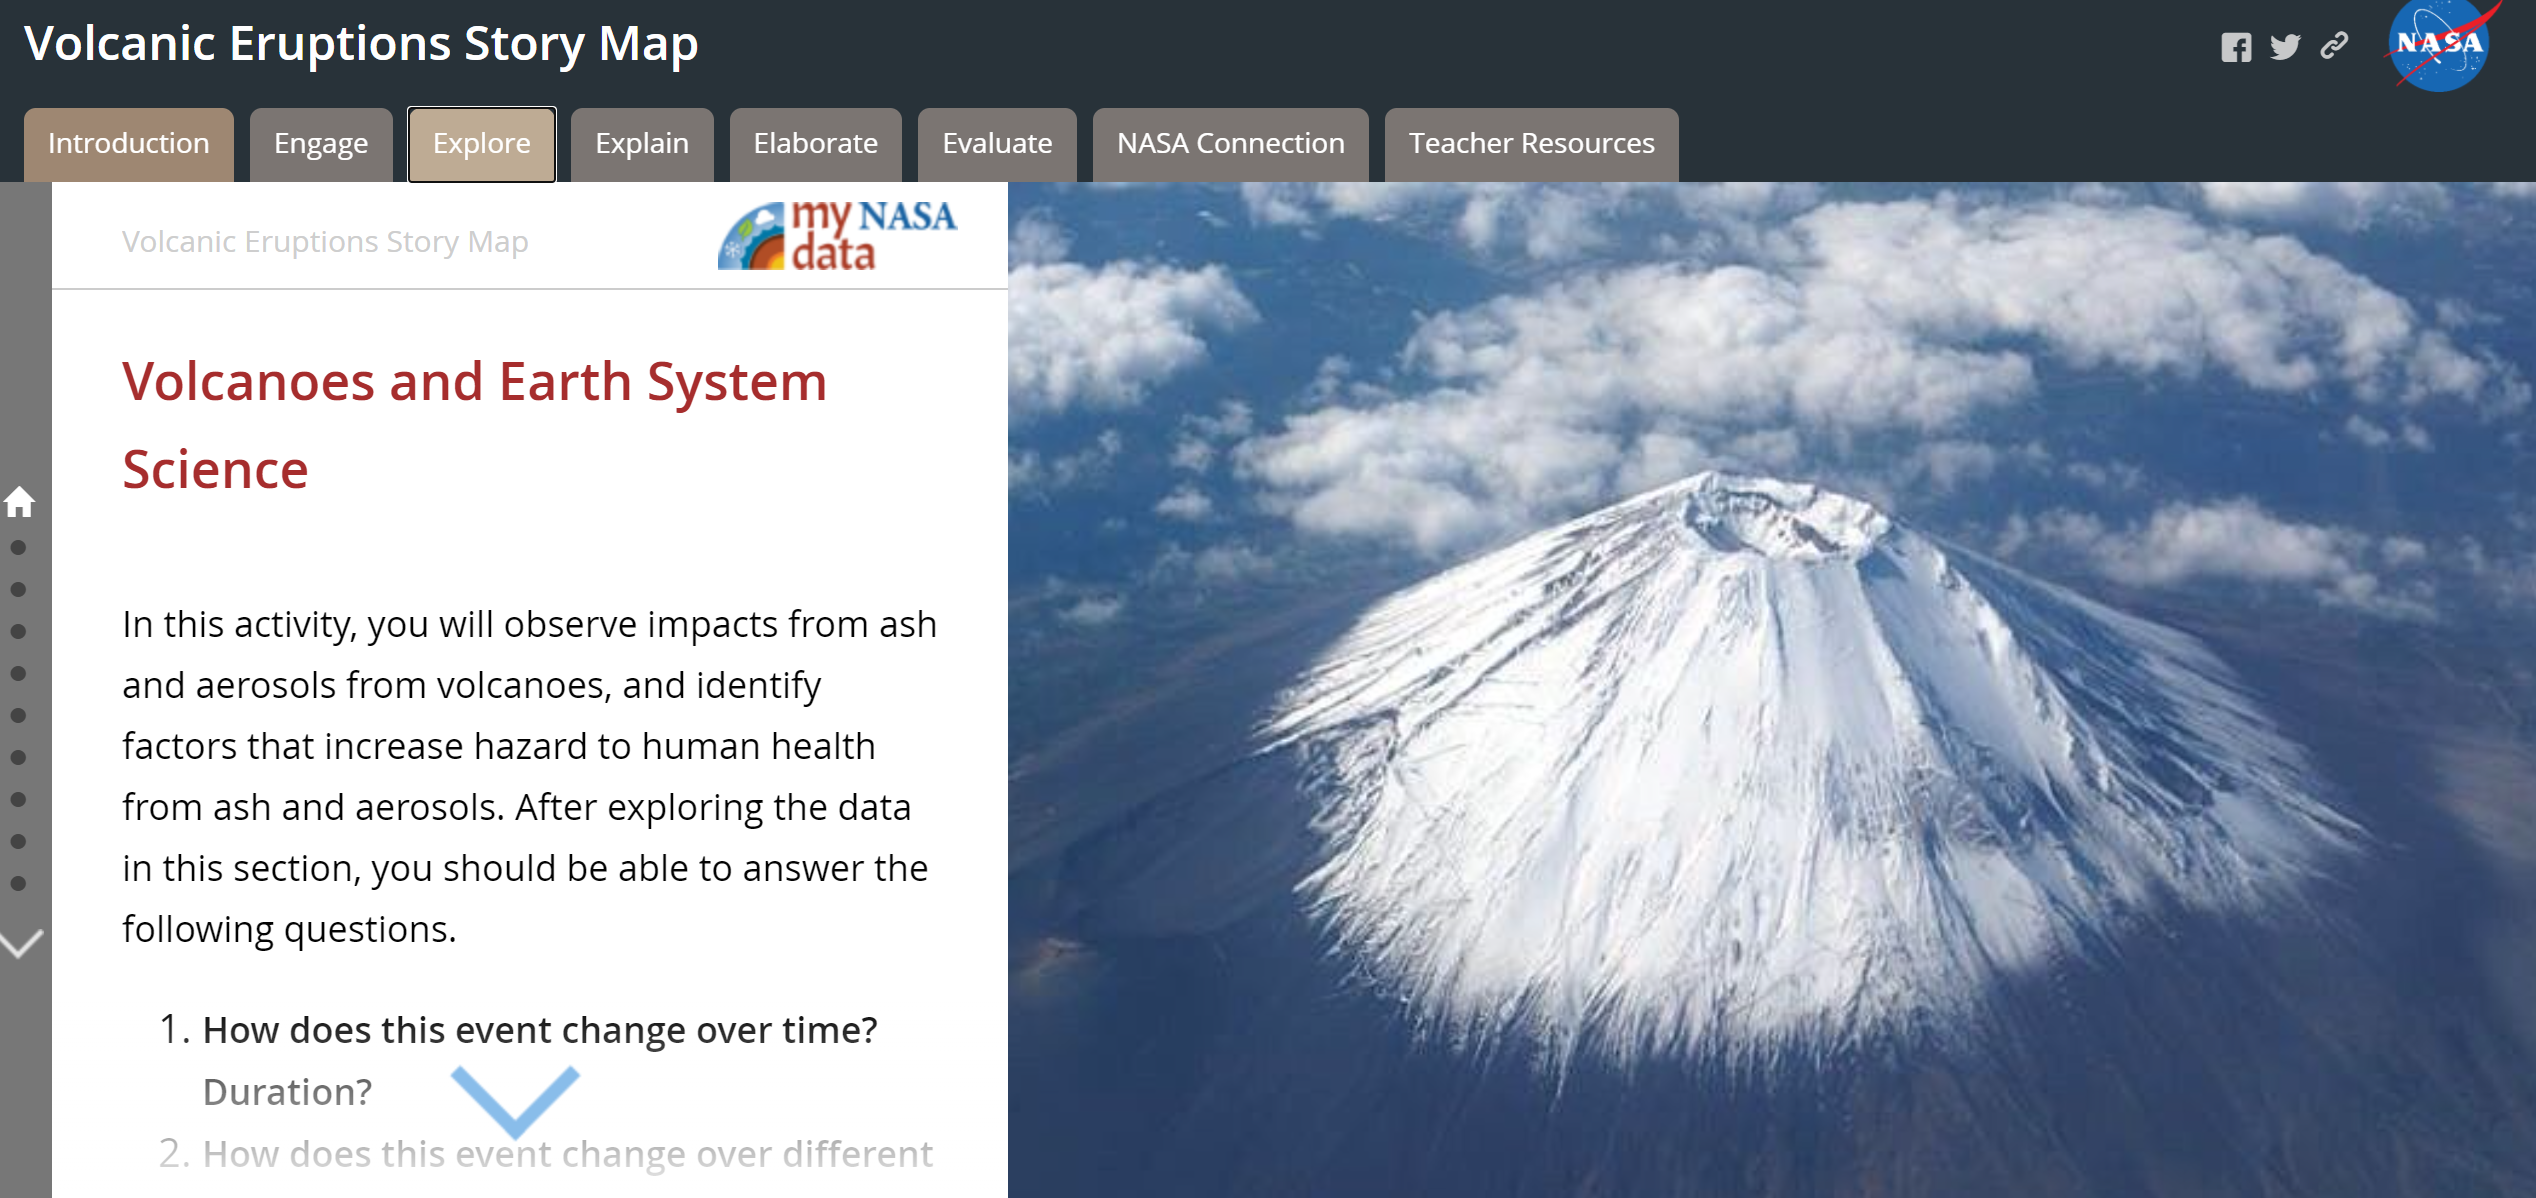
As a former social studies teacher and life-long lover of maps, the Story Maps section is the section of My NASA Data that grabbed my attention. There are six story maps in the Story Maps section. Those story maps are titled Volcanic Eruptions, Ocean Circulation Patterns, Global Phytoplankton Distribution, Sea Ice Extent and the Earth System, Creation of Urban Heat Islands, and Hurricanes as Heat Engines.
Each of the My NASA Data Story Maps includes detailed lesson plans and digital handouts for students. The lesson plans include prompts for exploring the data and information within each section of the story maps. All of the digital handouts can be distributed to students via Google Classroom (most of the handouts are Google Sheets or Docs).
My social studies background comes through when I look at resources like My NASA Data Story Maps. These story maps provide a good opportunity to help students make correlations between topics in science and geography.


