GPlates Portal is a resource that teachers of geology and geography will want to spend some time exploring. GPlates Portal is produced by the School of Geosciences at the University of Sydney. In the GPlates Portal you will find twelve interactive displays of geological and geophysical data.
Most of the interactive displays that you will find on GPlates Portal are too advanced for most high school settings. That said, there are two displays that are appropriate for middle school and high school settings. Those displays are the Rift Velocity map and the Paleo Map Maker.
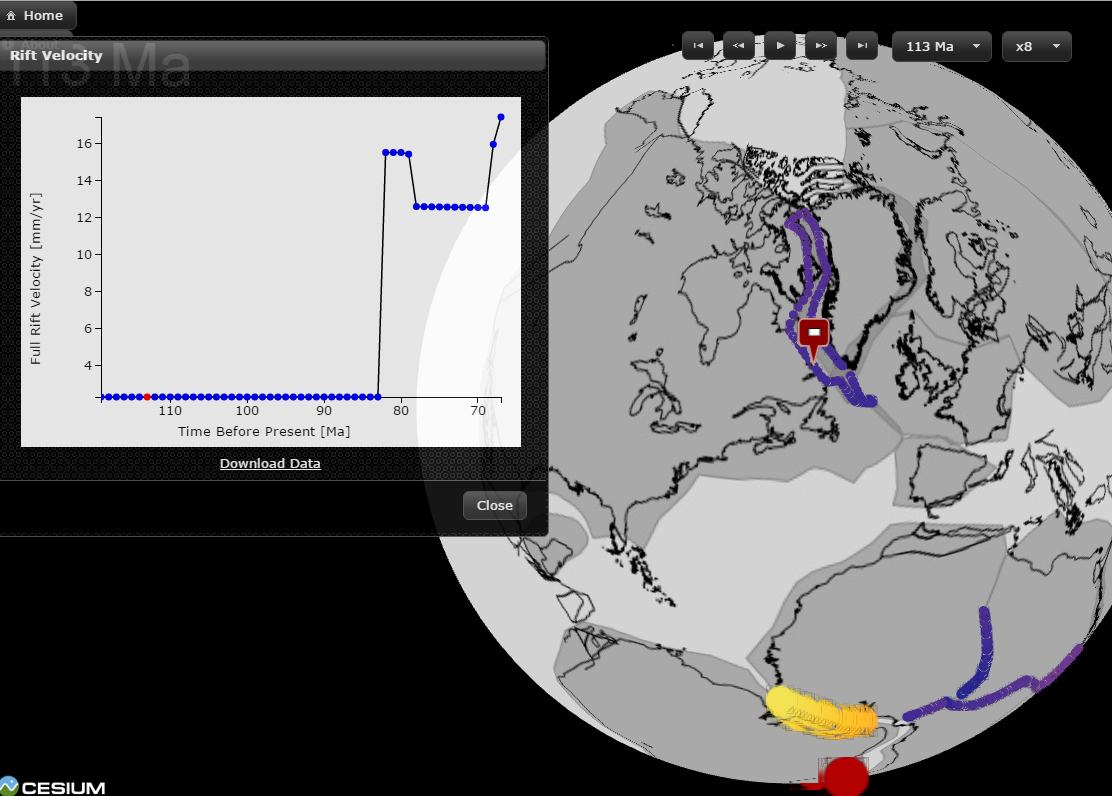
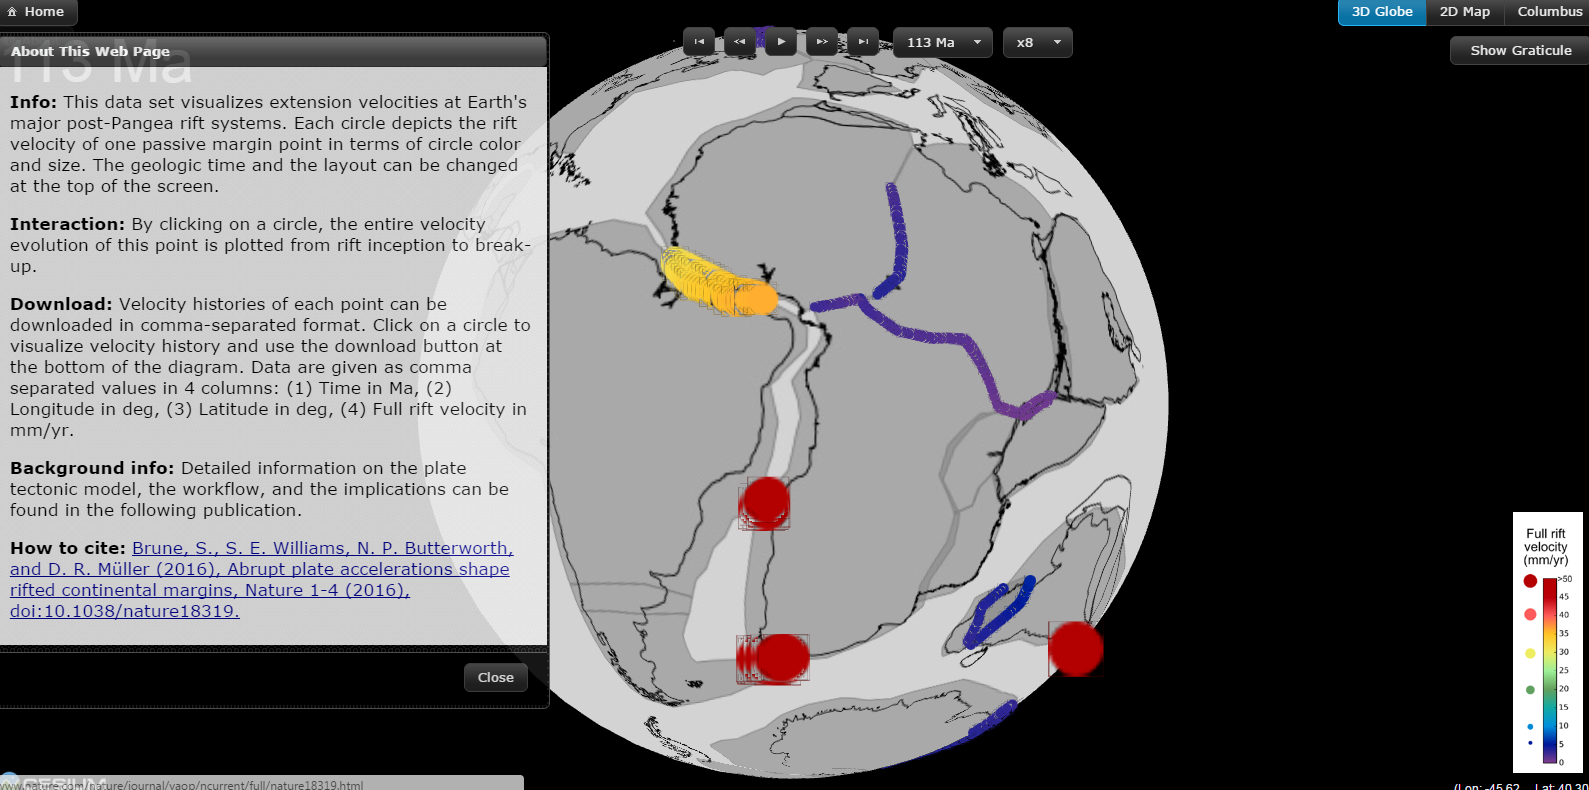
The Rift Velocity map provides a visualization of continental drift over time. The map includes a timeline that you can play back to see a visualization of continental drift. The divisions between each continent are highlighted on the map. Click on the highlights to focus-in a specific drift rate.
The Paleo Map Maker is similar to the Rift Velocity map in that you can see a visualization of continental separation. Rather than playing the visualization as an animation, the Paleo Map Maker lets you see static visualization of continental positions at specific times.
Applications for Education
The Rift Velocity map and the Paleo Map Maker could be helpful when trying to help students understand the rate of continental drift. The visualizations could also be useful in showing students how the continents moved to their current positions.
H/T to Maps Mania.


