This is a guest post from Jennifer Carey (@TeacherJenCarey) of EdTechTeacher, an advertiser on this site.
Desmos is a graphing calculator that allows you to plot functions, create tables, animate graphs, and more, all for free! In addition to creating static graphs and tables, users can integrate with sliders or animate them. For example, check out this graph that incorporates interactive sliders and rotation. You can see numerous examples of graphs that includes these features here.
Desmos is available for free online, as an iOS App, and as an Android App. If you are an educator, they curate a list of activities that integrate Desmos’s features, scaled for class and grade-level. For example, in the Hexagon Activity, students learn relevant vocabulary terms and features necessary in Geometry; they are presented with a variety of hexagonal shapes and then ask a series of questions to help them identify the shape that the computer has selected. To identify the correct shape, they will need to understand terms like acute, obtuse, or right angles. This is a great way to provide students a free, robust math tool as well as an outlet for their own creative energies.
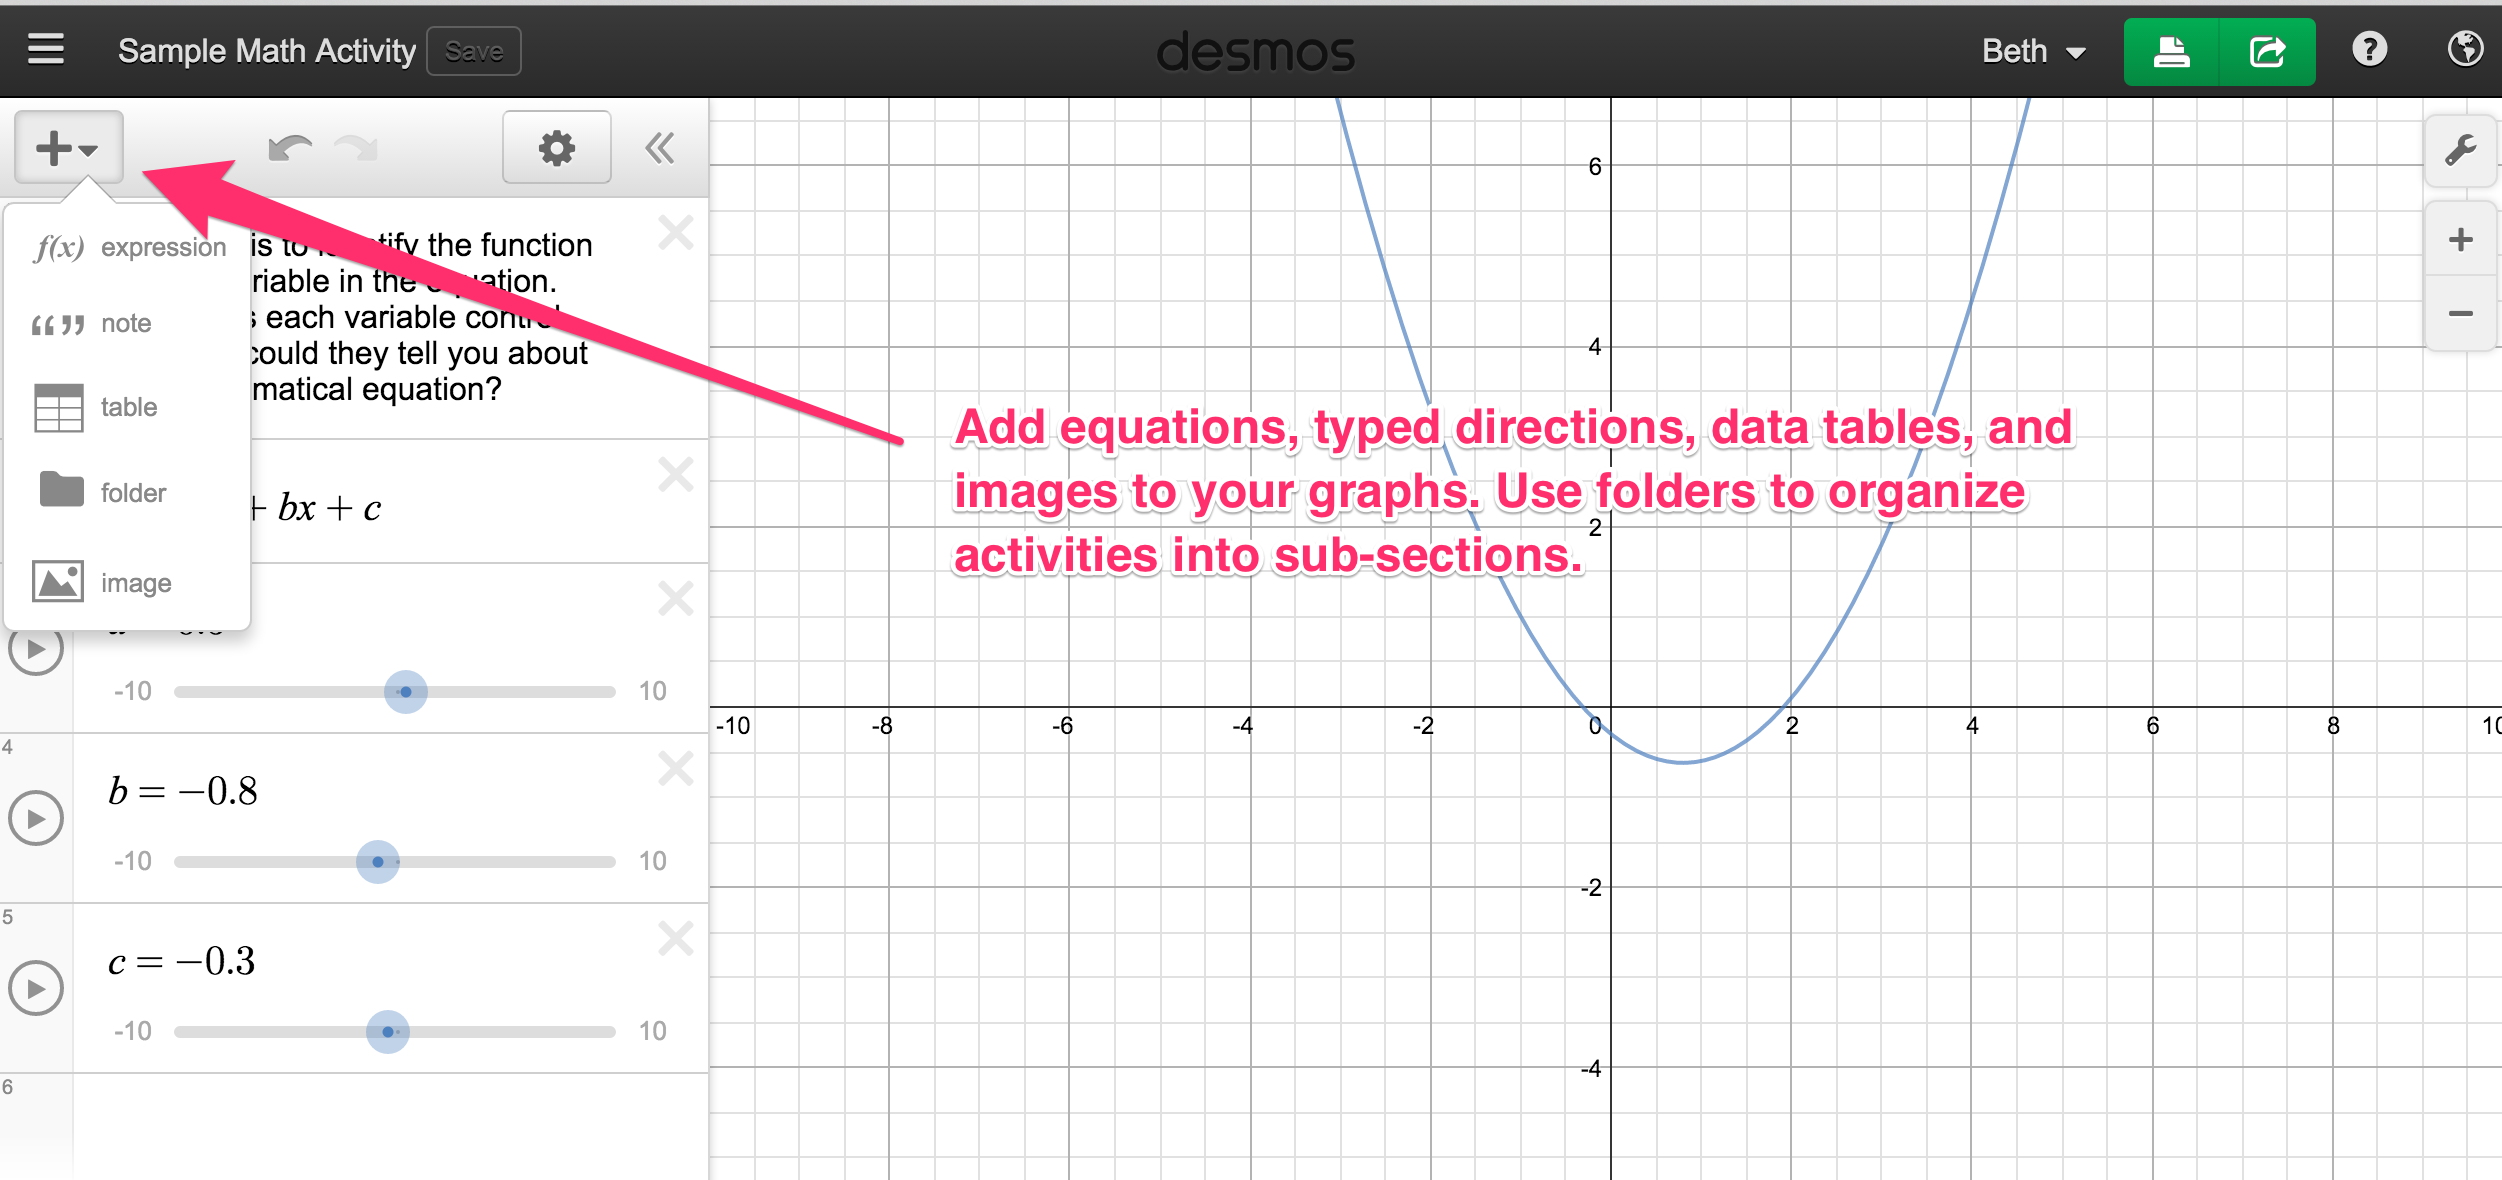
Another great feature of Desmos is the ability to create different types of hands-on math labs for students to explore. Sign into Desmos with your Google account, and then use the + icon to start creating.
Activities can be shared to students via a link or embed code as shown below.

While traditional graphing calculators may offer more functionality, Desmos provides students with an opportunity to create dynamic math and explore concepts in a different way.
For more math ideas, EdTechTeacher has a page of math recommendations on their web site. You can also come get hands-on with Chrome apps such as Desmos at their upcoming Google Jamborees!


